The Banking Industry’s Marketing Math Problem
Soon bank finance and accounting departments will start their annual budgeting. Marketing expenses are always a sticking point. There are areas within financial institutions where it is difficult to gauge the value that brand-building expenditures bring. This can be a stressful time for the marketing manager, but it doesn't have to be.
 By Jeff Marsico
Soon bank finance and accounting departments will start the annual budgeting ping-pong game. Departments will submit their budgets, the CFO adds them together and distributes them to the executive team, and everyone sighs. The CFO then bounces the budgets back to department managers asking them to do better. Rinse and repeat.
So, what should be cut to deliver the profits the board and shareholders expect? The head of lending points out that their elevated compensation expense is the result of an anticipated team lift out that will add $X million of new loan balances, interest income, and, ultimately, net income. The wealth management department says its new operating system will allow them to scale up assets under management by us much as 20% without adding staff, ultimately delivering a greater pretax profit margin.
What does your brand-building budget bring? There are areas within our financial institution where it is difficult to gauge the value that certain expenditures bring. When an IT manager asks for X dollars for new routers, he or she can cite “cybersecurity” to justify the expense. Who can complain about better cybersecurity?
This can be a stressful time for the financial institution’s marketing manager. Everyone is for having a superior brand, but what does a superior brand get you? Many marketing managers shy away from the question, offering up bromides such as “Our customers love us,” or “We’re more recognized than the competition.” But the question “What does a superior brand get you?” remains. Does it result in faster customer acquisition, greater customer longevity, or stronger pricing? The CFO is holding the budget numbers in her hand and wants to know.
All can be measured, and I suggest that you embrace measuring it in your journey to create greater operating discipline to deliver long-term stakeholder value.
Let’s focus on stronger pricing. In my book, Squared Away: How Can Bankers Succeed as Economic First Responders, I calculate bank brand value (BBV). You can calculate this too to see if your brand actually does equate to better price points. Among my firm’s outsourcing service clients, net interest income equates to greater than 80% of total revenue. This is common among community financial institutions, and our average outsourcing client has about $1.9 billion in total assets.
A superior brand would likely have a greater yield on loans than a loan peer group and a lower cost of funds than a deposit peer group. Both are easily measured using publicly available Call Reports.
I suggest creating different peer groups for loans and deposits. The loan peer group should have a similar loan mix, be of similar asset size, and be in your region. There should be eight or more financial institutions that you stick with for consistency and continuous improvement, only taking peers off of your list when/if they merge or experience some other significant change. If you have a brand superior to those in the group, your yield on loans should be better, indicating you have greater pricing power. Consider adding a control element for asset quality, such as subtracting nonperforming loans (NPLs) to loans from the yield on loans. So, if a bank gets greater yields because they take more credit risk, you have penalized that financial institution by subtracting NPLs/loans.
On the deposit side, search out a peer group that has a similar deposit mix, are of similar asset size, and are in your region. A superior brand should result in a lower cost of funds. That could mean you pay lower rates on deposits or have a greater proportion of noninterest earning deposit accounts. Either way, having a lower cost of funds would be an indicator that your deposit customers are not as price sensitive as customers of the peer banks.
If publicly traded, your financial institution can take the differences between your yield on loans minus NPLs/loans to peer, multiply by average loans, tax-effect it, and multiply by your price to earnings ratio to determine how much of your market capitalization is attributable to your loan brand value. Do the same for the difference between your bank and deposit peers’ cost of funds. Now, your marketing manager can say, “X% of our market capitalization, or $X million, is a result of our brand value.”
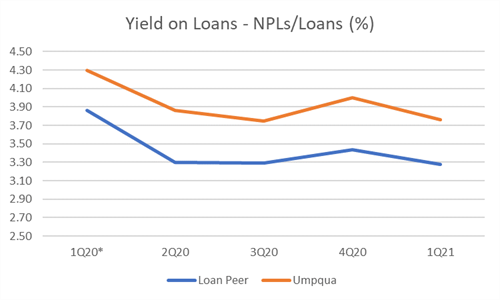
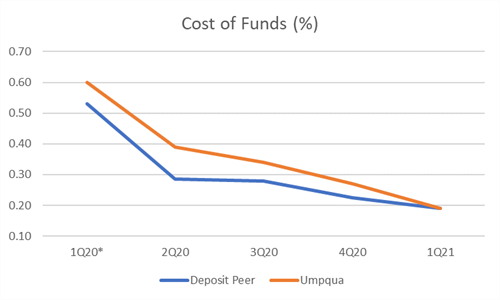
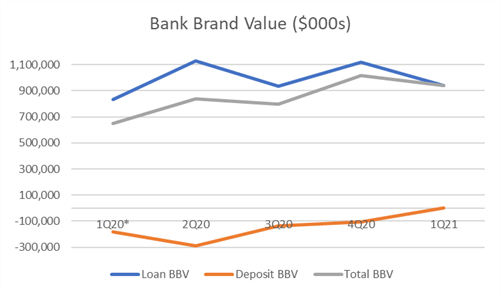
Let’s review this strategy with a bank that has been lauded as having a superior brand, Umpqua Bank in Oregon. See the below charts.


*Umpqua’s 1Q20 was adjusted for one-time items.
Umpqua’s marketing manager can defend the bank’s expenditure on branding because its ability to capture superior pricing resulted in $943 million of brand value. That represented 24% of Umpqua’s total market capitalization.
I don’t suggest settling on “spot” brand value calculations. As with many peer groups, apples-to-apples comparisons are difficult. But if you believe a better brand should result in better pricing, shouldn’t you calculate it and track its trend?
For Umpqua, it should consider replicating what they are doing on the loan side because all of their brand value is delivered through their lending groups. Branches and other deposit gatherers served as millstones because what was ballyhooed as its competitive advantage failed to deliver a lower cost of funds. However, the trending impact of cost of funds to BBV is positive. As a result of the higher cost of funds, Umpqua, as they should, joined the trend of larger financial institutions in consolidating branches.
Armed with this easily calculable, publicly available data, the executive team with the marketing manager should work on building a brand that continuously improves its cost of funds and maintains its advantage in yield on loans.
It is interesting to note that throughout the measurement period Umpqua did not have a materially different yield on loans than the loan peers. In only one of the five quarters did it exceed peer median. Where it exceled was in NPLs/loans. This means Umpqua captured very similar yields to its peers but with stronger asset quality. Who wouldn’t want that? And it is actionable data. Can Umpqua continue to keep pace with peer yields on loans while maintaining a portfolio with fewer nonperformers?
Measuring BBV, experimenting on how to improve it, and building accountabilities around it is critical to building the operating discipline where “We have a superior brand” actually means something.
Jeff Marsico is president of The Kafafian Group Inc., a finance, strategy, operations, and financial advisory consultancy in Parsippany, N.J., and Bethlehem, Pa., that specializes in profitability measurement outsourcing for community financial institutions.
Jeff Marsico will be speaking at PICPA’s Financial Institutions Conference. Get more insights from Marsico and many others at this all-virtual event on Sept. 23, 2021.
Sign up for weekly professional and technical updates from PICPA's blogs, podcasts, and discussion board topics by completing this form.
PICPA Staff Contributors
Disclaimer
Statements of fact and opinion are the authors’ responsibility alone and do not imply an opinion on the part of PICPA officers or members. The information contained in herein does not constitute accounting, legal, or professional advice. For professional advice, please engage or consult a qualified professional.


