Tax Cuts and Jobs Act’s Effect on Personal Income Tax
The Tax Cuts and Jobs Act of 2017 is the most significant reform to the Internal Revenue Code since the 1986 Tax Reform Act. The Tax Act dramatically changes 2018 tax filing for both individuals and corporations. This article focuses mainly on the changes affecting individual tax filers.
by Sean J. Brennan, CPA Apr 29, 2021, 13:48 PM
The Tax Cuts and Jobs Act of 2017 is the most significant reform to the Internal Revenue Code (IRC) since the 1986 Tax Reform Act. The Tax Cuts and Jobs Act (Tax Act) dramatically changes 2018 tax filing for both individuals and corporations. This article focuses mainly on the changes affecting individual tax filers.
Tax Filer Statistics
The number of federal tax returns filed in 2015 (the most recent data available) was 150.5 million returns. These returns had total income reported amounting to $10.4 trillion. Of the 150.5 million tax returns filed, 103 million used the standard deduction rather than itemizing deductions.A total of 114 million taxpayers who filed had taxable income, which amounted to $7.3 trillion, or an average of $61,404 of taxable income per return. Twenty percent of filers did not have taxable income. The average federal tax rate was 14.3 percent, but after accounting for refundable tax credits the average rate was closer to 13.3 percent.
About 6.2 million Pennsylvanians during this period filed federal tax returns, with total income of $410 billion. The per tax return income average was $66,129.
The following Pennsylvania 2015 federal tax filer statistics provide some local context:
- About 3.06 million tax returns were filed as single (about 49 percent of all tax returns).
- Almost 81 percent, or 2.46 million, of Pennsylvania single filers had taxable income under $50,000.
- Pennsylvania had 725,000 head of household tax returns filed, with 570,000, or 79 percent, of this category having earned less than $50,000 in taxable income.
- Pennsylvanians who filed married filing jointly totaled 2.3 million tax returns, with 625,000 of these returns, or 27 percent, having income less than $50,000.
Given the number of Pennsylvania federal tax filers who had income less than $50,000, I will, where appropriate, narrow any discussion of tax reform’s impact to highlight this group.
Deductions and Brackets
In assessing the impact of tax reform, we must assess where the most IRC changes have occurred. Much of the focus has been on the loss of particular itemized tax deductions. But as defined above, about 103 million (68 percent) of the American tax filing public (and 69 percent of Pennsylvanians) have been using the standard deduction and are unaffected by the loss of itemized deductions.However, a significant portion (about 31 percent) of Americans do itemize on their federal tax return. In Pennsylvania, about 1.7 million, or 27 percent, itemized their federal tax return. These percentages indicate that Pennsylvania is in line with both the national itemizing and standard deduction filing rates.
While we should not minimize the impact of tax reform on itemized tax returns (and the dollar impact of itemized deduction changes may be more significant), the inclusion or exclusion of certain itemized deductions does not appear to impact a majority of Americans or Pennsylvanians.
The Tax Act maintains the same tax filing statuses with single, head of household, and married filing jointly being the prevailing choices. What has changed is that for each filing status there has been an increased standard deduction amount, and income thresholds and filing status tax rate changes have been made.
Standard deduction – The standard deduction has increased between 84 percent and 92 percent over the 2017 standard deduction for the three main filing statuses.
Here is the 2018 standard deduction for each filing status had the law not been changed compared with the new standard deduction: single went from $6,500 to $12,000; married filing jointly went from $13,000 to $24,000; married filing separately went from $6,500 to $12,000; head of household went from $9,350 to $18,000.
The standard deduction rates have increased dramatically, but one must consider the Tax Act’s corresponding elimination of the personal exemptions. When factoring in the elimination of personal exemptions, the standard deduction increase may seem muted for some.
For example, a single filer who did not itemize a 2018 tax return would have had a $6,500 standard deduction and a personal exemption of $4,150. This would have offset adjusted gross income (AGI) by $10,650. That same single filer (not itemizing), using only the new higher standard deduction with no personal exemption, would offset taxable income by $12,000.
The key, however, for understanding all of a tax filer’s potential savings lies in the newly enacted tax bracket changes.
Tax brackets – Each tax bracket rate under the Tax Act, except the 10 percent and 35 percent tax brackets, is lower than the corresponding bracket rate under the old tax law. Additionally, the range of income amounts contained within certain brackets has been changed.
Under the old tax law there were seven brackets: 10 percent, 15 percent, 25 percent, 28 percent, 33 percent, 35 percent, and 39.6 percent. Under the new law, and regardless of filing status, the seven tax brackets have been adjusted to 10 percent, 12 percent, 22 percent, 24 percent, 32 percent, 35 percent, and 37 percent.
Many tax filers can expect to see some increased tax savings given the fact that standard deductions have increased and some tax credits have been expanded.
Assessing the Tax Act Impact
In assessing the specific changes on tax filing, first I’ll examine the changes made to the tax brackets and income threshold amounts, and then I’ll explain some federal tax filing data of Pennsylvanians.Single filers – The 2017 and 2018 tax bracket income thresholds for single filers are displayed in charts A and B below.
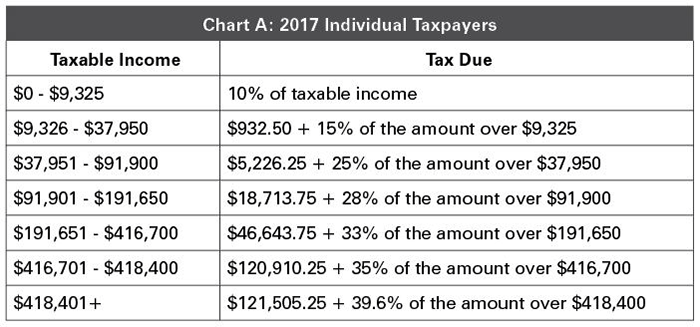
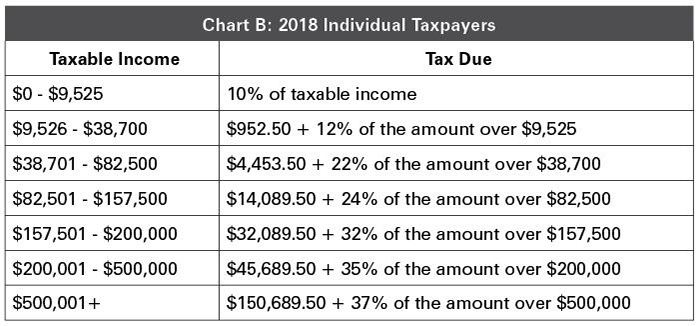
The first three single-filer brackets are fairly similar regarding income thresholds. Under the old brackets, the income taxed at 10 percent was taxed up to a maximum of $9,325; now the income maximum is $9,525.
The old second tax bracket, with a max tax rate of 15 percent and an income threshold up to $37,950, compares to a present 12 percent tax rate and a threshold of $38,700 of taxable income.
Four out of five Americans have taxable incomes within these lower two brackets, regardless of filing status. The second bracket captures the most taxpayers overall – in excess of 40 million.
The third 2017 tax bracket of 25 percent compares with a new lower bracket rate of 22 percent. However, the new corresponding income threshold amount has been lowered from $91,900 to $82,500.
The single-filer bracket with the most significant income threshold change is the old 35 percent bracket. The income previously included in this bracket has increased, from a narrow amount of $416,701 to $418,400 to a much wider income range of $200,001 to $500,000. This new 35 percent bracket income threshold amount was almost entirely within 2017’s 33 percent tax bracket. Thus, not every single filer will see their tax bill decline.
For the most affluent single filers – those with incomes in excess of $500,000 – taxable income amounts substantially over this top bracket amount will generate significantly higher tax savings. The top rate reduction to 37 percent from 39.6 percent for substantially higher and unlimited taxable income amounts will generate substantial savings for the 0.01 percent of all single tax filers taxed at this highest tax rate.
In Pennsylvania, 80 percent (2.4 million out of 3.06 million) of all single filers’ tax returns disclosed federal taxable income of less than $50,000. This income threshold would place these filers in the new 22 percent tax bracket or below.
We can compare the old and new brackets and determine the tax savings for those with incomes at various levels within the $50,000 range. We will use $25,000, $35,000, and $50,000 to cover a range of taxable incomes.
For taxable income at $25,000, the 2017 tax amount due would be $3,283. For 2018, the tax amount due would be $2,809, for a savings of $474 (or 14.4 percent). See the income level comparisons in chart C below.

Head of household – The 2017 and 2018 tax bracket income thresholds for head of household filers are in charts D and E below.
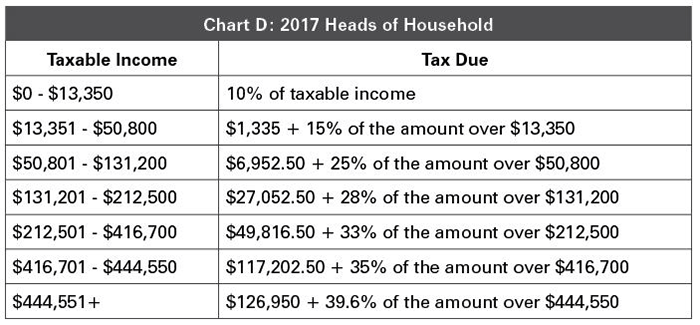
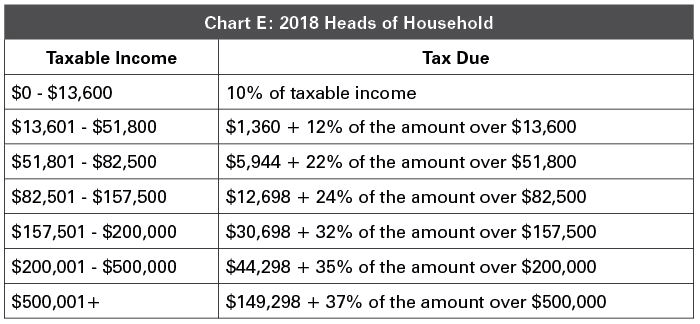
The head of household 10 percent tax bracket has a $250 increase to the threshold from 2017 to 2018. The second bracket has a rate reduction down to 12 percent, and a $1,000 increase in the threshold amount – up to $51,800.
The head of household threshold at the second tax bracket is much higher than it is for single filers. The 2018 12 percent single filer tax bracket has a maximum income threshold of $38,700, but the 12 percent tax bracket for head of household has a threshold of $51,800. When comparing single 2018 income thresholds versus head of household 2018 thresholds there is a significant variance between 2017 and 2018.
Much of the fourth through seventh tax bracket income thresholds, as seen in the 2018 single bracket changes, have been broadly aggregated into the new 35 percent bracket ($200,001 to $500,000). Previously, the 35 percent bracket had narrowly defined income threshold amounts between $416,701 and $444,550. What previously took three incremental bracket increases to achieve, the new brackets “get there” (to 35 percent) in one larger bracket.
Using Pennsylvania’s federal statistics, 78 percent, or 569,000 of the 725,000 federal returns filed in the state, had income below $50,000. Therefore, in assessing the impact of Tax Act changes on head of household filers in Pennsylvania, a presentation of three income levels can be seen in chart F below.

For Pennsylvania head of household filers at or near these three taxable income levels, a tax savings should be anticipated. Dependents and the corresponding exemptions must also be considered as affecting head of household tax savings, as well as the savings for those who are married filing jointly.
Exemptions and credits – Dependent exemptions, as previously stated, will no longer reduce AGI to arrive at taxable income. For those with dependents, the possibility of a larger Child Tax Credit (CTC) or the Earned Income Tax Credit (EITC) are distinct savings possibilities.
Pennsylvanians took the following credits and exemptions:
- Approximately 11 million personal exemptions, with the exemption amount being $4,000 in 2015 (and subsequently indexed higher).
- 3.4 million dependent exemptions. About 45 percent of these dependent exemptions were taken by those with incomes less than $50,000.
- 840,000 Pennsylvania taxpayers took the CTC. 320,000 of these Pennsylvanians also had income less than $50,000. This does not include the additional CTC.
- 961,000 Pennsylvanians took the EITC, and almost 100 percent of the credit amount (nearly $2.1 billion), was taken by those with incomes below $50,000. These amounts do not include excess EITC.
- Eliminating the exemption initially reduces potential individual tax savings and amounts to a loss of $44 billion in Pennsylvania tax reduction.
The 2018 CTC has been increased from $1,000 to $2,000, and the phaseout threshold has been increased from $75,000 to $200,000. This may be the single largest individual Tax Act change, and many additional Pennsylvanians will avail themselves of these dependent-related tax credits.
Chart G below shows the new phase-out levels for the CTC.

This change means that more taxpayers will receive the CTC, and it will be higher for many already receiving the credit. Many Pennsylvanians may find this realization more agreeable than the mere reduction of adjusted gross income by the eliminated exemption amount.
The tax savings from EITC has not been altered by the Tax Act.
A head of household filer’s potential tax savings, when compared to 2017, is shown in chart H below.
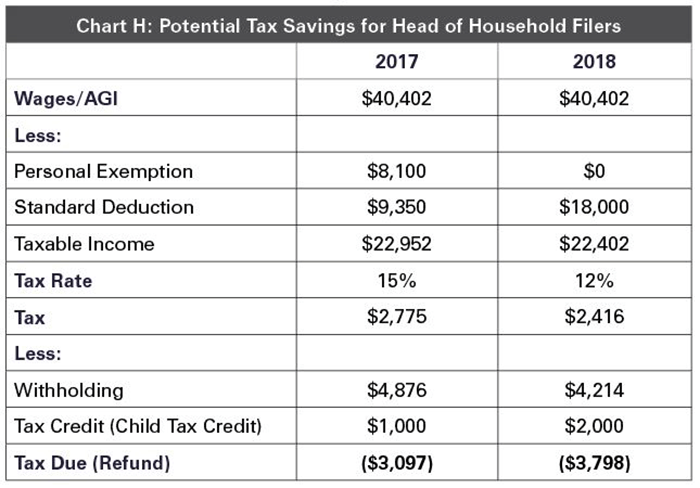
This additional refund is due in part to the decreased tax rate and, more significantly, to the increased CTC.
Married filing jointly – The 2017 and 2018 tax bracket income thresholds for married filing jointly filers can be seen in charts I and J below.
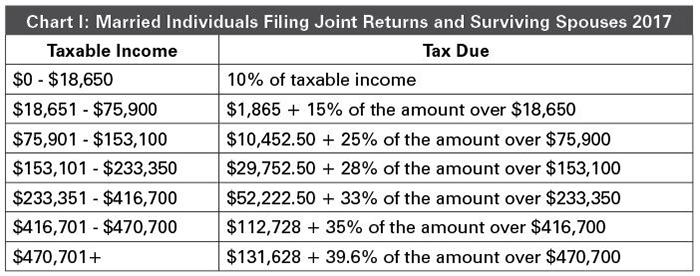
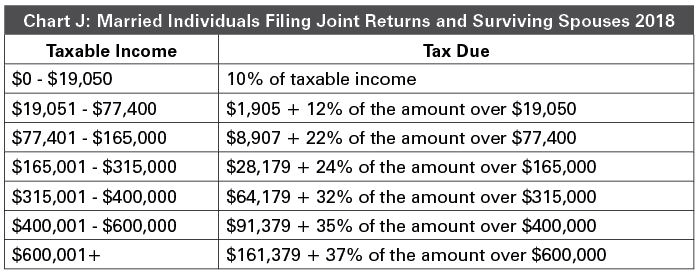
The married filing jointly income thresholds are usually double the 2018 single filer income thresholds.
About 27 percent of Pennsylvanians who submitted married filing jointly federal returns had incomes less than $50,000. This category generally includes the wealthiest Pennsylvanians.
To cover the same percentage of Pennsylvanians (as analyzed previously at about 80 percent), we need to increase the income threshold. A $200,000 threshold covers about 90 percent of all married filing jointly Pennsylvanians.
For the comparison table displayed in chart K below, Pennsylvania taxable income threshold amounts of $50,000, $100,000, and $200,000 are used.

This group of married (and wealthier) Pennsylvanians continues the tax savings trend. Additional factors, previously discussed, may impact this category’s results. The broader availability of the CTC (coupled with the existing EITC) will mitigate the loss of some itemized deductions and the personal and dependent exemptions.
Since 90 percent of all married filing jointly Pennsylvanians have taxable income less than $200,000, more married Pennsylvanians should qualify for the expanded CTC because many likely have dependent children.
Taxpayers at higher income levels, such as those married filing jointly, likely will continue to itemize their tax returns as they had done previously.
Consider these points about Pennsylvanians filing 2015 married filing jointly returns with itemized deductions:
- 1.7 million federal tax returns from Pennsylvania used itemized deductions.
- 1.4 million federal tax returns from Pennsylvania had incomes in excess of $50,000.
If we apply the 22 percent married filing jointly tax bracket, which incorporates many Pennsylvanians, to the projected loss of a Pennsylvanian’s average state and local itemized tax deduction of $7,001; these itemized filers would have a corresponding tax increase of $1,540.
Only those with other, higher itemized deductions, or those with dependents, can be certain of how to quickly mitigate or offset the loss of one particular itemized deduction or other lost or limited deductions. Other itemized filers, losing certain deductions and without tax credits, will be looking to the decreased tax rates to potentially mitigate the effect of higher taxable income.
The loss of certain itemized deductions in the new Tax Act will, for many itemizers, especially those without dependents, increase taxable income.
More tax filers who previously itemized will now file taxes using the standard deduction. Those married taxpayers who previously itemized but didn’t have a mortgage interest deduction, for example, may not have sufficient itemized deductions to surpass the higher 2018 standard deduction threshold.
Conclusion
Many Pennsylvanians, at differing levels of income and with differing filing statuses, will be uniquely affected by the Tax Cuts and Jobs Act. The underlying complexity of the act needs to be evaluated for all clients so that we CPAs can fully understand the benefits received and the benefits taken.Tax planning, when addressed at the earliest possible time and while our clients are tax-focused, will minimize the Tax Act’s unanticipated consequences.
Sean J. Brennan, CPA, is president of Brennan and Company CPA PC in Philadelphia, and chair of the PICPA Federal Taxation Committee. He can be reached at sean@brennanandcompanycpa.com or on Twitter @brennanandcomp.

