Story Time: CFOs Can Make Their Financial Tales Engaging with a Good MD&A Report
Have you ever produced financial statements that you reported out at a monthly management meeting only to be met by blank stares on the faces of those without a financial background? It can be unsettling, but it can be overcome. To break through those blank stares, you have to tell the financial story of your organization in a meaningful way to those with diverse backgrounds and varying levels of financial knowledge.
by Michael F. De Stefano, CPA Nov 30, 2021, 15:37 PM
 Have you ever produced financial statements that you reported out at a monthly management meeting only to be met by blank stares on
the faces of those without a financial background? It can be unsettling, but it can be overcome. To break through those blank stares, you have to tell the financial story of your organization in a meaningful way to those with diverse backgrounds and
varying levels of financial knowledge.
Have you ever produced financial statements that you reported out at a monthly management meeting only to be met by blank stares on
the faces of those without a financial background? It can be unsettling, but it can be overcome. To break through those blank stares, you have to tell the financial story of your organization in a meaningful way to those with diverse backgrounds and
varying levels of financial knowledge.
Engaging use of a management discussion and analysis (MD&A) report is one way to increase the chance of success. The MD&A can serve as a bridge between an organization’s financial results and the meaning behind those numbers as it relates to daily operations and strategic objectives. And once an MD&A is rolled out to management team members, it becomes the signature report that facilitates the narrative of the organization’s progress.
A note before you read on: This feature was written from the perspective of entities operating within the private sector and does not address requirements of public companies under the U.S. Securities and Exchange Commission, governmental entities under the Governmental Accounting Standards Board, or any other entity operating within regulated industries that would require an MD&A as part of the periodic financial reporting package.
What Is an MD&A Report?
An MD&A report is not intended to replace historical financial statements, such as the balance sheet, income statement, and cash flow. Rather, it will supplement those reports by taking a more detailed look at what is driving the numbers within the financial statements. The ultimate goal of any MD&A should be to effectively report out the historical operations of the company with an eye toward supporting future decisions the organization will face.
There are no set criteria (such as size, industry, etc.) for a privately held organization to be able to benefit from an MD&A: you only need an interest in sharing information across the management team. An MD&A report can be used in almost every professional setting. One factor that may vary is the frequency of the report (monthly, quarterly, or annually), and that would depend on an entity’s specific need.
When financial statements are distributed to owners and the management team, questions inevitably come up about why fluctuations are occurring between the data presented. These questions reflect our coworkers trying to understand what occurred and what may be changing within the entity. Management team members often will theorize why certain results are occurring or what is causing a trend. This is a good way to start a dialogue, but it can’t stop there: theorizing can leave others with a false sense of what is occurring. The MD&A provides concise reporting on the actual explanations as opposed to relying on theories. Done properly, the MD&A will provide explanations from a historical perspective and offer valuable information for future decisions.
What Should Go into the MD&A
Financial professionals should start by listening to the questions and information requests coming from the management team and other leaders within the organization. This is a good indicator of the appetite for information. A common request is for a deeper dive into information already contained in existing financial statements. Many questions will surface about the operations of the business, especially if reported results do not line up with the expectations and desired outcomes. For example, if you report gross margin for a specific segment that varies from the expected outcome, this would be a great place to dive deeper and explain why.
An MD&A report is not final after rollout. Consider it a living document that will evolve as you receive more input on areas that others would like expanded. This feedback is important to tailoring the MD&A to your organization and meeting the needs of the intended users. I have found that reporting on the basic financial information in narrative form will initiate conversation, and that discussion can help shape future iterations of the MD&A. New information, too, will expand upon the existing report and drive conversations about the business and uncover even more.
Where to Start?
If you are considering an MD&A report for your organization, the first speed bump you may encounter is, “What should it look like?” A great place to start is the operations of a business. Following the flow of the income statement takes the reader directly into the operational results by examining the drivers of gross margin and net income.
Typically, data is presented in a monthly or quarterly manner and compared to the budget for the current month and actual prior-year data. This gives you three points of measurement to begin framing operational results. Taking this a step further, the same data can be presented on a year-to-date basis compared with the year-to-date budget and year-to-date prior-year information. It would be a good idea to separate the monthly/quarterly and year-to-date numbers to allow space for commentary on the results of each section. Commentary is key: without it, the report would just be a verbal regurgitation of the income statement.
Gross margin can have multiple components, so this is where the author can dig into the weeds of the monthly and year-to-date numbers. Consider breaking down information by product line to compare trends or reporting information using a presentation by month, especially where seasonality may exist.
What follows is an example of a revenue and gross margin presentation.
Revenue – Net revenue for the company for the six months ended June 2021 totaled $17,600,000, which was a 4.3% increase, or $726,000, from the prior-year amount of $16,874,000. The breakdown of net revenue by product line is presented in this chart:
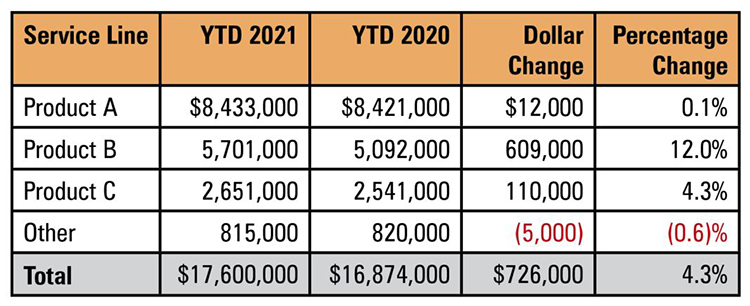
Product A remained consistent year over year, which meets expectations given ratable consumption throughout the year and minimal changes in the sales price. The revenue from product B increased over 2020 by 12% due to the increase in market share within the Mid-Atlantic region resulting from the acquisition of Company X in the fourth quarter of 2020.
Net revenue for the company for the six months ended June 2021 exceeded the budgeted amount of $17,250,000, which was favorable by 2%, or $350,000. The primary factor contributing to the favorable variance was the revenue of product B exceeding projections by 12,000 units. Other contributing factors included securing a new customer for product C, which resulted in an additional 1,200 units being sold. This new customer has signed a contract to provide an additional 3,000 units per quarter beginning with the third quarter of 2021
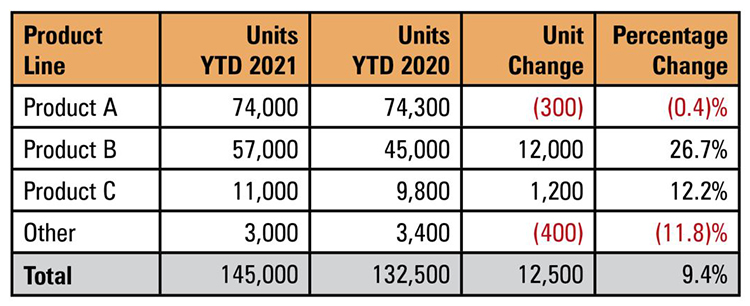
Production – Year-to-date production for 2021 totaled 145,000 units, which was an increase of 12,500 units from the prior-year quantity of 132,500 units. The production unit breakdown by product for 2021 and 2020 is as follows:
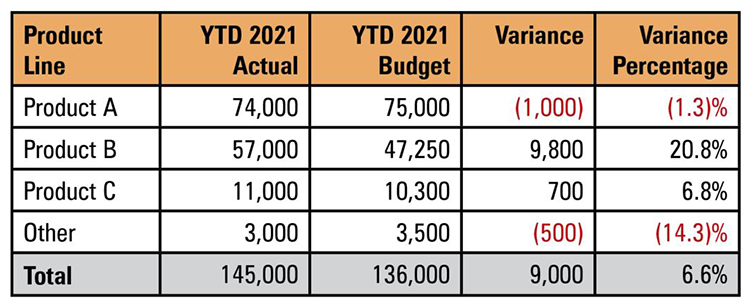
Production compared to budget:
A similar analysis for gross margin results could further incorporate the production expenses into the write-up. Highlighting the reasons behind the results and fluctuations in the early part of the MD&A sets the tone and reinforces the basis of understanding. Focus on unusual fluctuations, but put those into context with updates on relevant factors, such as market conditions, competitor activity, and internal challenges.
After discussing the organization’s core revenue-generating activities, the report naturally flows into operations. This is an opportunity to look at notable aspects of the business that can span both the balance sheet and income statement accounts. Balance sheet accounts can include dives into assets and liabilities. Income statement sections can include payroll and benefits, marketing activities, facility charges, and other areas worthy of highlighting.
Below is an example of an operational activity presentation.
Net income – Net income for 2021 totaled $10,905,000, which was an increase of $1,005,000 from the prior year-to-date total of $9,900,000. Net income reported for March 2021 was $3,400,000, which was an increase of $825,000 over the March 2020 total of $2,575,000.
Cash flows – The company ended the month with cash balances of $541,000. The company reported positive cash flow for the month of $312,000. Cash inflows for the month were $2,841,000 and exceeded cash outflows for the month of $2,529,000.
Trade receivables – As of June 30, 2021, net trade accounts receivable totaled $919,000, a decrease of $101,000 over the June 30, 2020, net balance of $1,020,000. These figures are net of the reserves for finance charges and doubtful accounts. The combined reserves at June 30, 2021 and 2020, were $109,000 and $91,000, respectively. Outstanding receivables over 90 days past due totaled $227,000, which individually range from balances of $1,900 to $64,000 (Customer X). Customer X has entered into a payment agreement whereby they will remit monthly payments of $16,000 in each of the next four months.
This commentary can continue for other major categories on the balance sheet, such as inventory; property, plant, and equipment; line of credit; and term debt. Consider including commentary on other relevant areas, such as payroll and benefits and operating expenses incurred in arriving at net income.
Other MD&A Considerations
Not all items included in the MD&A need to be financial. People are often one of an organization’s most valued resources, so consider covering human capital and employee benefit matters, such as new additions, terminations, significant hires, health insurance contract updates, and 401(k) and profit sharing.
Where accounting policies are important to understand, the MD&A could offer a new way to communicate important assumptions and estimates to others on the management team. This can be expanded to include capital resources, internal control modifications, and relevant related-party information.
Additionally, it is good practice to include an update on key initiatives underway or planned, such as new IT software or systems, upgrades to manufacturing processes, or organizational restructuring or changes.
The end goal of an MD&A report is to facilitate information-sharing and strengthen decision-making within the organization. Over time, an MD&A can become both analytical and predictive in nature, providing management with better tools to improve operations and, ultimately, the bottom line.
Michael F. De Stefano, CPA, is chief financial officer for RKL in Lancaster and a member of the Pennsylvania CPA Journal Editorial Board. He can be reached at mdestefano@rklcpa.com.

Leave a commentOrder by
Newest on top Oldest on top