Digital Dashboards Can Improve Nonprofit Management
For a nonprofit to achieve its mission despite strong headwinds, it needs efficiency and innovation. Digital resources, for example, can make nonprofits more agile and responsive. Dashboards, specifically, offer a gateway to real-time financial reporting and operational visibility and can help nonprofit leaders drive change, accountability, and improvements.
 By Victoria Pritchard
Today’s nonprofits face more challenges than ever, from donor competition to talent acquisition to economic conditions. Achieving their mission while confronting the strong headwinds of change takes efficiency and innovation. Digital resources can make nonprofits more agile and responsive, with the ability to scale as needed for future growth and complexity. Dashboards – a gateway to real-time financial reporting and operational visibility – are one of the most commonly used digital resources. This blog looks at how dashboards can help nonprofit leaders drive change, accountability, and improvement within their organizations.
Reporting: Requirements vs. Reality
Nonprofits face an array of reporting requirements and demands:
- Stewardship and reporting by funds, grants, and donors
- Compliance with federal regulations and donor restrictions
- Demands from board members and executives for greater transparency and reporting
- Real-time access for stakeholders and staff spread across multiple locations
In reality, though, many nonprofit leaders cite delayed access to data, lack of clarity on performance, and manual processes as causes of inefficiencies and major barriers to strategic improvement.
There’s another reason nonprofits need more timely, insightful reporting – donor due diligence. According to Snapshot of Today’s Philanthropic Landscape: A Guide to Philanthropy in the U.S., the overwhelming majority of donors consider available information before making a charitable donation. Donors want evidence of solid financial stewardship and strong mission impact. In fact, 76% of donors are concerned about how much money goes to an organization’s overhead and 56% research how an organization spends its funds. The most successful nonprofits use data to enhance their story and quantify impact and progress toward their mission; dashboards are a convenient, powerful way to synthesize and home in on those data points and key metrics.
What Is a Dashboard?
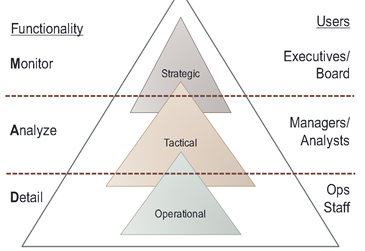
Dashboards are a type of graphical user interface that provides at-a-glance views of key performance indicators. There are three functional uses of dashboards – to monitor, to analyze, and to detail. The graphic below illustrates these functions and aligns them with key user groups and their roles within an organization.

These are often referred to as role-based dashboards, as they provide an at-a-glance view of relevant information based on a team member’s specific duties and responsibilities. Here are some examples of how a nonprofit could configure role-based dashboards for key user groups:
- Leaders: Visibility into revenue and operational efficiency
- Program managers: Metrics related to programs and budgets
- Development: Fundraising goals and campaign performance
- Audit firm: Read-only access to information to streamline the audit process
Metrics beyond Financials
If reports are solely based on financial metrics, it can be difficult for nonprofit leaders and current or prospective donors to understand progress toward the mission and the scale of success. Nonprofits can round out their story by including outcome metrics into their dashboards. The most beneficial outcome metrics tie back to a nonprofit’s mission and include any measures that reflect organizational performance and impact, such as performance (e.g., program efficiency or use of funds), outcomes (e.g., meals served), capacity (e.g., membership growth), or sustainability (e.g., operating reliance).
Benchmarks are another useful data point to include in a dashboard. Organizations such as the National Council of Nonprofits, the Foundation Center, and Charity Navigator are trusted and credible sources. While it may not be desirable or permitted to publicize every piece of financial data tracked by the dashboard, outcome metrics can also be useful public relations tools for internal and external constituencies when published to an organization’s website.
Having an integrated and user-friendly source of financial and outcome-related metrics allows nonprofits to be more transparent and provides the proof and accountability that board members, executives, and donors desire. Dashboards provide an efficient and effective solution for making nonprofits more prepared to withstand changes in economic and social conditions to not only survive, but also thrive.
Victoria Pritchard is a senior consultant with the financial management solutions practice of RKL in Exton, Pa. She can be reached at vpritchard@rklcpa.com.
Sign up for weekly professional and technical updates from PICPA's blogs, podcasts, and discussion board topics by completing this form.
PICPA Staff Contributors
Disclaimer
Statements of fact and opinion are the authors’ responsibility alone and do not imply an opinion on the part of PICPA officers or members. The information contained in herein does not constitute accounting, legal, or professional advice. For professional advice, please engage or consult a qualified professional.


