This is the archive of CPA Now blogs posted on the PICPA website through April 30, 2025. Want more recent blogs?
Artificial Intelligence in a CPA World, Today and Tomorrow
Artificial intelligence (AI) is becoming more common in the CPA’s work life. It often shows itself in predictive, suggestive, and consultative tools that can improve your work product. This blog focuses on some of the AI in Microsoft Excel and how it offers opportunities for productivity gains.
 By Bruce E. Lane, CPA
The difficulty in writing about artificial intelligence (AI) is first defining it. It’s a concept that holds different meanings for different people. The Merriam-Webster dictionary lists two definitions:
- “A branch of computer science dealing with the simulation of intelligent behavior in computers”
- “The capability of a machine to imitate intelligent human behavior”
Using these definitions, particularly the first one, it is clear AI is becoming more common in the CPA’s work life. It often shows itself in predictive, suggestive, and consultative tools that improve our work products.
Everyday examples can be found in Microsoft Outlook, Word, and Power Point, where the programs generate suggestions, such as reminding us to attach a document to an email or checking the formatting of a document. Based on what we are doing, the applications predict our intent and suggest a best practice. Many of us, myself included, click on “Stop Suggesting,” much like we would do if someone in our office were looking over our shoulder and commenting on what to do next. This is not to say that the suggestion is not valuable; rather, it may not be applicable. AI continues to develop and improve with the prevalence of cloud applications. This allows publishers to have continual contact with behaviors and outcomes to provide better analytics that can be used in AI predictions.
There are even more features released in recent years that we may not be using. In this blog I will focus on Microsoft Excel since it is a tool that many CPAs use frequently and which offers an opportunity for productivity gains.
I will discuss three Microsoft Excel features here that I also demonstrated at the PICPA A&A Conference in December 2020:
- Data Types
- Quick Analysis
- Analyze Data (previously known as Ideas)
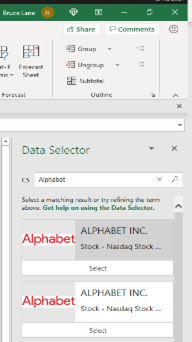
Data Types is important to anyone who needs to gather and update facts and statistics quickly and consistently. Currently, there are 20 data types in Microsoft 365 Excel. Below is an example of the stock data type. Others include currency, geography, cities, and universities. Once the entry is identified by the feature, an icon for that data type appears next to the value.

If not appropriate, suggested matches will appear on the right side of the sheet from which you can select the appropriate value. You now have access to data related to those items.
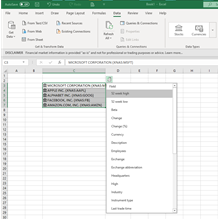
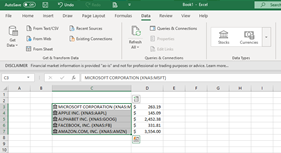
You can access data related to a highlighted item or select information to be inserted into the table for all or just selected values. In the case below, it is for the 52-week high. The data inserted can be updated at any time using the Data Refresh feature.
You can learn more by visiting this page published by Microsoft.
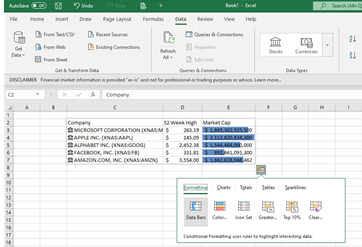
When presenting data, we typically have an end in mind. We are looking to draw attention to an area or make some other impact. The appropriate presentation will vary with the data and the audience. Once the applicable data is highlighted the Quick Analysis feature icon will appear in the lower right-hand corner of the table.
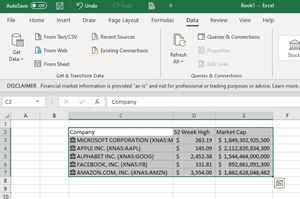
This indicates that Excel is prepared to suggest presentations for that data. Clicking on the icon opens a menu.

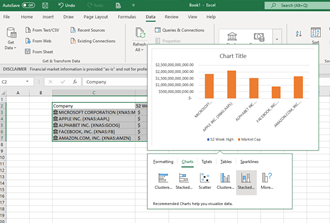
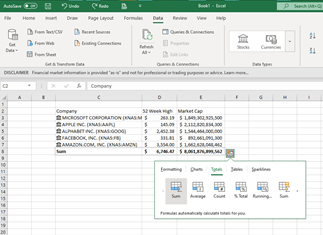
Each tab will display options which, by placing the mouse over it, will display the result. Here are a few examples:
Data Bars
Charts
Totals
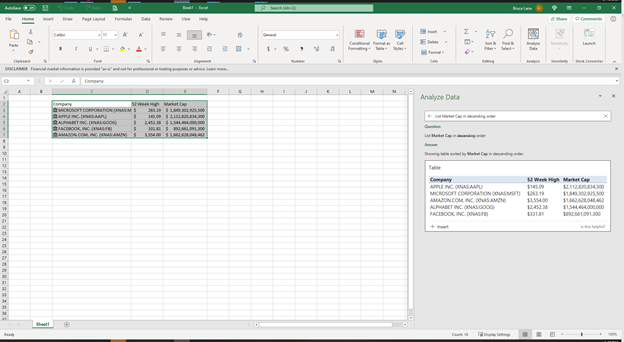
To access additional capabilities for data analysis, highlight the same data and click on the Analyze Data button on the Home Ribbon.
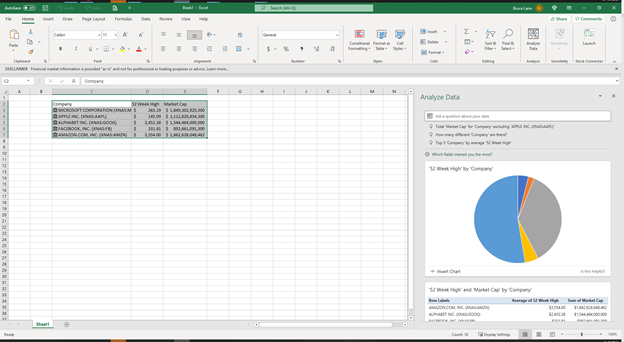
You will be presented with the Analyze Data window, which provides suggested graphs that can be inserted into the sheet. At the top of the Analyze Data window is a natural language query box. Simply type in a question or command: the answer appears below. I typed “List Market Cap in descending order.”
So, what does the future hold? In short, predictive capabilities.
Although the tools to predict results have existed for years, the algorithms used had limited amounts of structured data to build and train models. Now that so many applications are cloud-based, the amount of structured data has rapidly increased. AI learning models require history to build the model, then new and current data to train and adjust the model to increase accuracy.
Predictive capabilities can impact several areas of any business. Examples include optical character recognition that converts an image into structured data, expected collection of accounts receivable, supply chain forecasts for demand and lead times, and so on.
AI requires machine learning to train the model. In the case of accounts receivable, machine learning looks at the output of the accounts receivable collection systems. AI takes historical data and adds labels to the data, indicating whether the collection was on time, late, or very late, then stores that data. The model will continually train itself and score its predictions against what occurred using the variables in the transaction to find relationships that get closer to 100% accuracy. Variables could be the customer, the amount, the products, time of the year, billing cycle, payment terms, shipping location, and so on. Data science will find relationships between the data and the results that are difficult, if not impossible, for the human brain to do quickly and accurately.
AI effectiveness is growing due to one major factor: massive amounts of data. The trend in data migrating from on-premises systems to the cloud has provided that resource which machine learning requires to train artificial intelligence models. The larger the population, the more accurate AI will be in predicting the future.
Bruce E. Lane, CPA, is a technical specialist U.S. – Dynamics 365 finance & operations/commerce – for Microsoft in the Greater Pittsburgh area. He can be reached at bruceelane@verizon.net.
Lane will be a presenter at the 2021 PICPA Accounting and Auditing Conference webcast on Dec. 9-10. Sign up today to attend one or both days.
Sign up for weekly professional and technical updates from PICPA's blogs, podcasts, and discussion board topics by completing this form.

