Bring Significance to Journal Entry Testing: Identify the Anomalies of Fraud Using Benford’s Law
Benford’s Law has been around for more than 80 years, and it is a great way to identify red flags of fraud when testing journal entries.
 By Rob Forney, CPA, M.Acc.
With the advancement of data analysis software, Benford’s Law has become a standard tool for auditors at some large and midsized CPA firms during journal entry testing. Data analysis software offers this type of review, complete with calculation charts and graphs, with just a few clicks. But spending a significant amount on data analysis software isn’t necessary to run a first digit Benford’s analysis. Here, I explain how to use this 82-year-old rule to catch today’s fraudsters.
Benford’s Law
Frank Benford, an early 20th century physicist and Johnstown, Pa., native, is attributed with the formulation of “The Law of Anomalous Numbers.” He was guided toward his discovery based on the wear and tear he observed on the common logarithmic books widely used by scientists in his time for their calculations. He noticed that the pages of the books that calculated logs starting with one and two were more worn than the pages calculating logs starting with eight or nine.
Benford launched a study to investigate the phenomena. He observed numbers from 20 different population subgroups, pulling in values from census data, newspapers, and death rates, among other sources. From his sample of 20,229 data points, he concluded that the distribution of first digits in large, calculated datasets, when plotted on a graph, mimics this curve1:

Journal Entry Testing
Benford’s first digit analysis is a great tool to use for journal entry testing to find incongruity and potential fraud. And it’s not terribly difficult if you’re comfortable with a spreadsheet.
The first step is to set up a chart that will show the expected count distribution. Mimicking the above mentioned formula, enter the following formula into the cell next to “1”: =(LOG(1+(1/A))/LOG(10)). “A” should reference the spreadsheet cell “1”. This formula will yield the expected percentage for each of the possible leading digits.
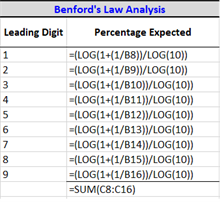
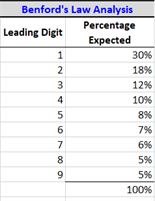
Check the results by summing the percentages to be sure the total is 100%. These percentages are universal and serve as the benchmark for this analysis.
After the auditor obtains the client’s general ledger and agrees it to the year-end trial balance, identify how many line items make up the general ledger. The total number of lines will drive how many of each value should be expected. After calculating the total number of lines, a forecast should be made to show how many of each value should be expected.
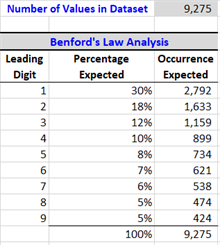
Next, the auditor should collapse debits and credits into one column, keeping both sides positive. Use a “left” function to identify the first digits on every line. Some adjustments might be needed if the dataset includes entries of less than a dollar. To correct these, ignore any leading zeros, and manually key the first digit. For example, $0.03 would have “3” in the first digit column.

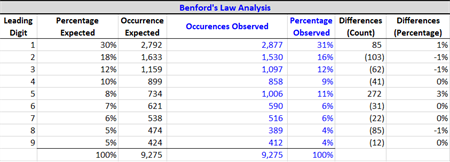
Next, use a “countif” function to calculate how often each digit shows up in the first spot, then identify count and percentage variances.
Analysis
After calculating the variances, you need to determine how large of a difference is too large. This takes a mixture of statistics and professional judgement. Statistically, look at the Z-score of each variance. Z-scores measure the statistical significance of each difference observed. To calculate this we would need to use the Z-score formula for difference of ratios: =abs(A)/sqrt((B*(1-B))/C), where A equals the difference between expected and observed percentages, B equals the expected percentage as a decimal, and C equals the total number of lines in the general ledger. If the calculated Z-score is above 1.96, then that value is to be considered significantly different (assuming 95% confidence),2 and testing journal entries with these leading digits should be considered.
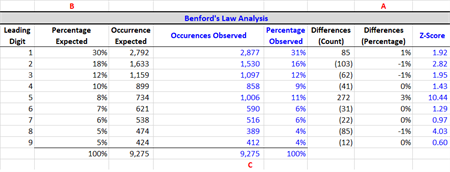
In the above example, the leading digits with statistical significance are 2, 5, and 8 because their calculated Z-scores are above the 1.96 significance threshold. Using this dataset, an auditor would consider some of the usual red-flags, including weekend entries, off-hours entries, or debits to revenue accounts. After boiling down the entries to a more concise list, the auditor should select an entry that has a 2, 5, or 8 as a leading digit. Statistically speaking, the author would likely pick from the 5 group.
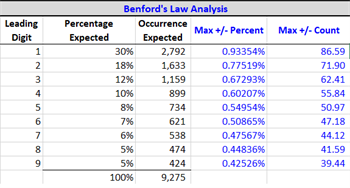
But statistics only takes you so far. One of the pitfalls of this type of analysis is that it can raise false red flags, so professional judgement must be considered. With a sample size of 9,275, as shown below, the maximum difference allowable for “1” is 86. The 87th “1” would be a red flag per this analysis. A larger sample size would push the upper threshold higher and allow for more flexibility in leading digits. But all that being said, a double-digit Z-score isn’t something to ignore.
Benford’s Law and Madoff
Juan C. Chang, a graduate student at Penn State University, wrote his master’s thesis in 2017 on Benford’s Law and some of the ways it can be used to analyze corporate financial statements. One of the datasets he analyzed were monthly gain and loss figures reported by Bernard L. Madoff Investment Securities LLC to its customers. He analyzed 217 data points from December 1990 through December 2008 using a similar method as described above, and found that the data points were statistically significant and did not follow Benford’s Law. In his paper, Chang translated his Z-scores to p-values, with any p-value below .05 being deemed significant. His analysis found a p-value of 0.0247, concluding that the dataset did not follow Benford’s Law. He then analyzed just the data points from 1990-1999, and found that the data was even more significant, rendering a p-value of 0.0021. Chang concluded that if this type of analysis was performed nine years earlier, Madoff’s scheme could have been uncovered earlier.3
Now, armed with the ability to benchmark using Benford’s Law, you can make your journal entry testing more significant!
1 Frank Benford, “The Law of Anomalous Numbers,” Proceedings of the American Philosophical Society, 78(4) (1938), pgs. 551-572. http://www.jstor.org/stable/984802
2 Using Benford's Law to Detect Fraud, ACFE (2018).
3 Juan C. Chang, A Study of Benford's Law, with Application to the Analysis of Corporate Financial Statements (Unpublished master's thesis), Pennsylvania State University (2017).
Rob Forney, CPA, M.Acc., is a semi-senior accountant at GMS Surgent Certified Public Accountants & Advisors and a member of the Pennsylvania CPA Journal Editorial Board.
Sign up for weekly professional and technical updates in PICPA's blogs, podcasts, and discussion board topics by completing the form here.
PICPA Staff Contributors
Disclaimer
Statements of fact and opinion are the authors’ responsibility alone and do not imply an opinion on the part of PICPA officers or members. The information contained in herein does not constitute accounting, legal, or professional advice. For professional advice, please engage or consult a qualified professional.


