Subscribe for Weekly Updates

State and Local Tax Burden: Pennsylvania Ranks 21st
By Rachel Flaugh
In February 2023, the Pennsylvania Independent Fiscal Office (IFO) released its annual report, State and Local Tax Revenues: A 50 State Comparison. For all 50 states, the report compares state and local taxes paid relative to total state income (referred to as the average tax rate or ATR) and the distribution of state and local taxes across revenue sources. The latest report uses state tax revenues for fiscal year (FY) 2020-2021 and local tax revenues for FY 2019-2020 (due to a data lag). The analysis compares those tax revenues to calendar year (CY) 2020 total state personal income. Due to the COVID-19 pandemic, all states received large infusions of federal stimulus funds (e.g., economic impact payments, expanded SNAP benefits, Pandemic Unemployment Assistance), and that temporary income is included in the computations. For CY 2020, $50 billion of temporary stimulus funds are included in Pennsylvania state personal income.
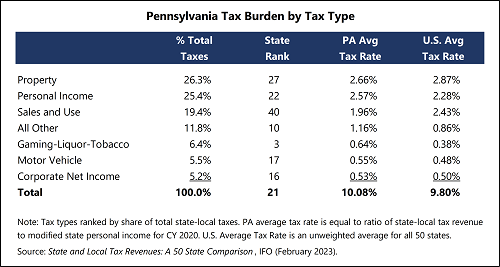
Property taxes comprise the largest share of state and local tax revenue in Pennsylvania at 26.3% (see table). Across all 50 states, Pennsylvania ranks 27th for property tax with an ATR of 2.66%, which is lower than the U.S. average (2.87%).1 Compared with prior reports, the Pennsylvania property tax ATR declined. This is mainly due to three factors: most counties reassess property values infrequently, millage rate increases are capped due to the Act 1 index, and the temporary influx of federal stimulus funds.

The second largest source of state and local tax revenue in Pennsylvania is personal income tax (PIT), which comprises 25.4% of total revenues. Pennsylvania is 22nd for PIT with an ATR of 2.57%, higher than the U.S. average (2.28%). Although Pennsylvania has a relatively low and flat tax rate, there are no deductions or personal exemptions. Moreover, nearly all municipalities levy an earned income tax, which is included in the computation and is unusual compared to most other states.
Sales and use tax (SUT) comes in third, contributing 19.4% of Pennsylvania’s total revenues. The state holds the 40th spot for SUT with an ATR of 1.96%, notably lower than the U.S. average (2.43%). The low ATR is largely due to the exclusion of most services from tax and broad exemptions for groceries and clothing. Some states also levy SUT on gasoline, but Pennsylvania does not.
“Other” taxes – which include inheritance, gross receipts, realty transfer, and other miscellaneous taxes –comprise 11.8% of the state’s total revenues. Pennsylvania is 10th among other taxes with an ATR of 1.16%, higher than the 0.86% U.S. average.
The so-called “sin” taxes (gaming, liquor, and tobacco taxes plus lottery net profits) are the fifth largest source of Pennsylvania revenue at 6.4% of the total. Pennsylvania ranks third for sin taxes with an ATR of 0.64%, higher than the U.S. average (0.38%). Pennsylvania’s high rank is driven mainly by the availability of legal gaming and relatively high tax rates on slot (maximum rate of 55.0%) and table game (16.0%) gross revenues. For CY 2023, Pennsylvania levies the 14th highest cigarette tax rate of $2.60 per pack. In Philadelphia, the combined state and local tax rate is $4.60 per pack.
The sixth largest source of Pennsylvania tax revenue is motor vehicle taxes, which comprises 5.5% of total revenues. Pennsylvania is 17th for motor vehicle taxes with an ATR of 0.55%, slightly higher than the U.S. average (0.48%). Although Pennsylvania effectively levies the highest gasoline excise tax ($0.611 per gallon), the state rank is much lower because the Pennsylvania vehicle registration fee for passenger cars is comparatively lower than other states.
Out of the seven categories, the smallest source of revenue is corporate net income tax (CNIT), which represents 5.2% of total revenues. Pennsylvania ranks 16th for CNIT with an ATR of 0.53%, slightly higher than the U.S. average (0.50%). As of January 2023, Pennsylvania levies the fifth highest CNIT rate (8.99%), but for the report’s time period, the tax rate was third highest (9.99%). Although the rate rank is high, the ATR rank is lower because Pennsylvania uses separate entity reporting (as opposed to combined reporting) and sales-only factor apportionment. Both generally reduce the tax base compared to the alternatives. Moreover, some firms might opt to do business as a pass-through entity due to the much lower tax rate (3.07%).
Overall, Pennsylvania ranks 21st for all state-local taxes with an ATR of 10.08%. The U.S. average is 9.80%. If a weighted U.S. average had been used, so that states like California, New York, and Texas have a larger impact on the average, then the U.S. ATR would be somewhat higher (10.14%). Finally, note that the computations exclude severance taxes (and the impact fee). This is because analysts generally assume those taxes are exported to the final consumers who reside in other states.
1 This is an unweighted average so that all states have equal weight.
Rachel Flaugh is an analyst with the Independent Fiscal Office. She works on issues related to state and local taxation, financial taxation, natural gas, and performance-based budgeting and tax credits.
Sign up for PICPA's weekly professional and technical updates by completing this form.
Statements of fact and opinion are the authors’ responsibility alone and do not imply an opinion on the part of the PICPA's officers or members. The information contained herein does not constitute accounting, legal, or professional advice. For actionable advice, you must engage or consult with a qualified professional.


Leave a commentOrder by
Newest on top Oldest on top